English
 Türkçe
You switched to high-efficiency electric motors, yet your energy bill did not drop as much as you expected. More often than not, the problem is not a "bad" motor but a mismeasured saving. If production went up, the weather warmed, the number of shifts changed, or your line ran a different product mix, then a raw kilowatt-hour comparison will mislead you. This is exactly where the EnPI baseline and normalization approach defined by ISO 50006 comes in. A properly built energy performance indicator isolates the real saving you achieved by moving to an IE4 or IE5 class motor, stripping away the noise from production volume, load, and ambient conditions. In this article we walk through how to establish a baseline, choose the right indicator, normalize it with regression, and verify the saving step by step.
Why a Raw kWh Comparison Misleads
Suppose you consumed 100,000 kWh the month before renewing a motor fleet and 95,000 kWh the month after. At first glance you would assume a 5% saving. But that figure alone means nothing. If production volume fell in the same period, if the weather cooled and reduced the cooling load, or if you stopped a line for maintenance, you cannot separate how much of the saving came from the motor and how much from other causes. Energy consumption is never an independent number; it always depends on one or more relevant variables. ISO 50006 requires you to identify those variables and normalize consumption against them so that any comparison is fair.
In practice three traps appear most often. The first is change in production volume: processing more tons of steel, more litres of milk, or more pieces naturally increases energy. The second is environmental conditions: ambient temperature directly drives the load of compressors, cooling towers, and ventilation motors. The third is the operating profile and run-time; whether the same motor turns 8 hours or 20 hours a day, and whether it runs at partial or full load, changes the result. Every comparison made without accounting for these three drivers is open to dispute.

The ISO 50006 Framework: EnPI and EnB
ISO 50006 is a guidance standard that supports the ISO 50001 energy management system and is used to measure energy performance. It rests on two core concepts. The first is the EnPI (Energy Performance Indicator), the metric that expresses the energy efficiency of a facility or a motor system numerically. The second is the EnB (Energy Baseline), the energy baseline derived from a historical reference period against which future performance is compared. A saving is simply the difference between the consumption the baseline predicts and the consumption that actually occurs.
Choosing the Right EnPI
The choice of EnPI depends on the process you want to measure. Several typical options exist:
- Specific energy consumption (kWh/ton, kWh/piece, kWh/m³): the most common indicator in production-driven plants; it shows energy spent per unit produced and inherently decouples the metric from volume change.
- Motor system efficiency (mechanical output power / electrical input power): when tracking a single drive, it reveals how efficiently the motor and its drive work together.
- Consumption per unit time (kWh/operating hour): suitable for fans, pumps, and compressors that run continuously at a steady load.
- Load-adjusted consumption: defined for systems on variable-speed drives so that it reflects efficiency at partial-load points.
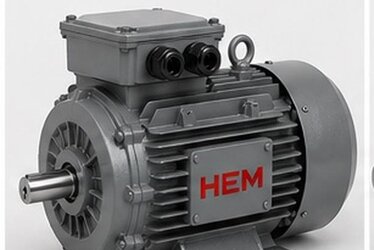
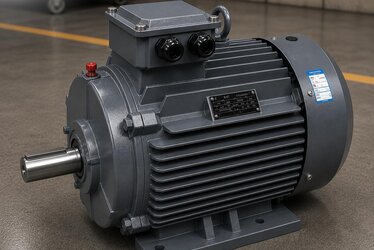
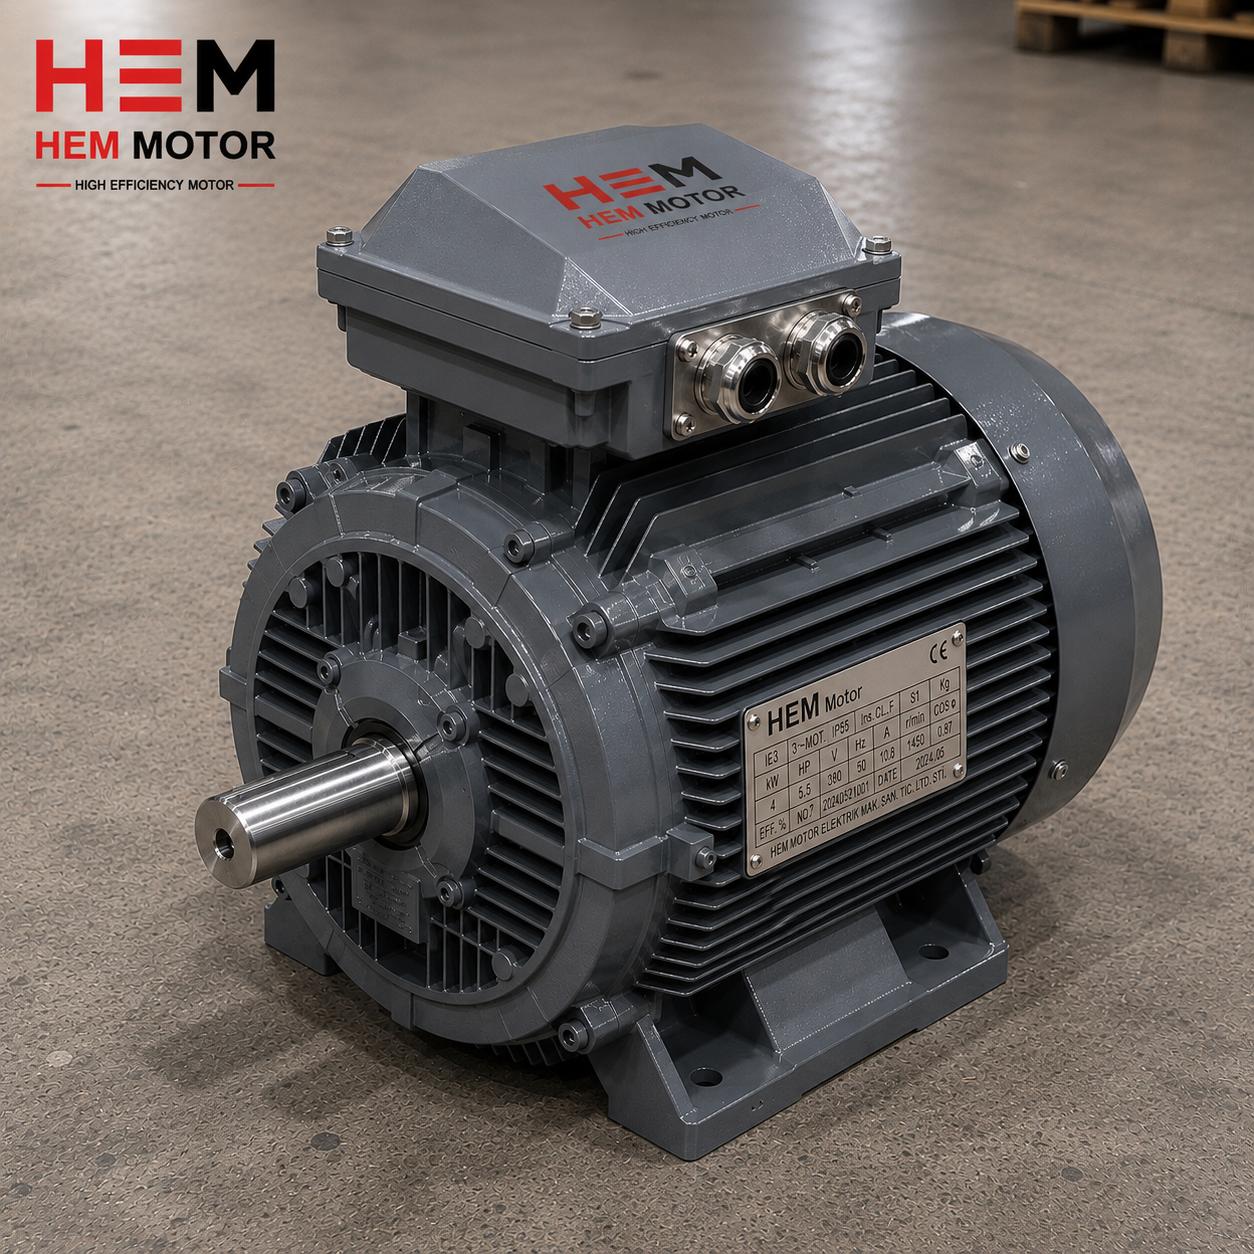
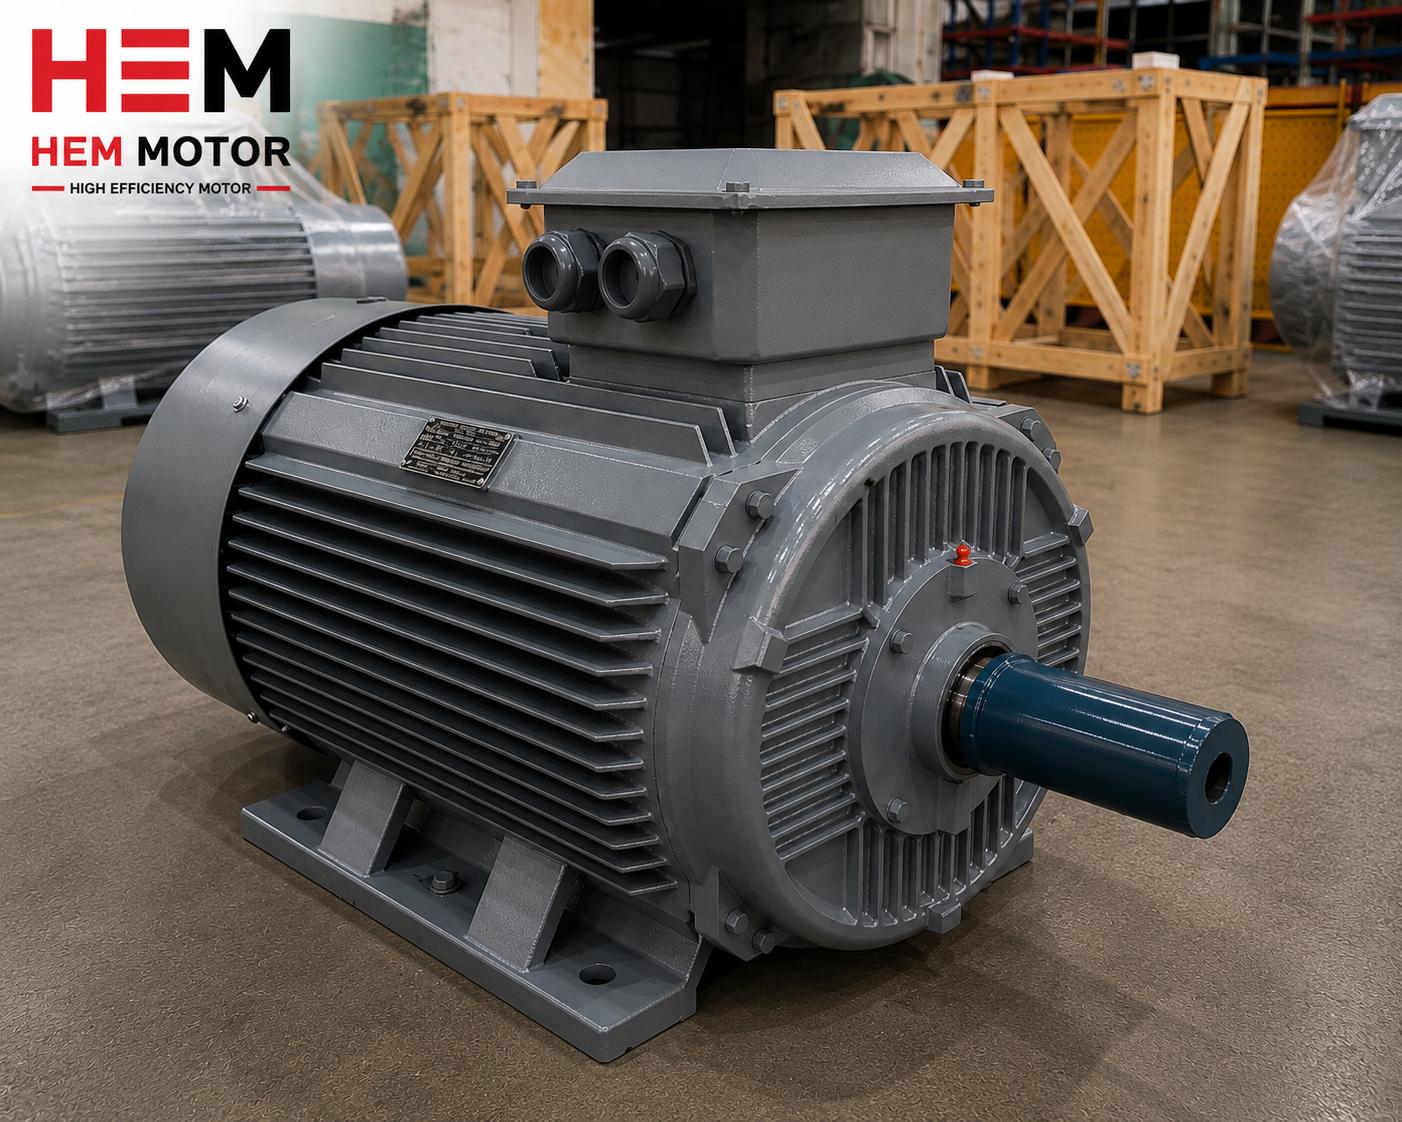
HEM Motor's range, spanning IE3 Premium, IE4 Super Premium, and IE5 Ultra Premium from 0.55 kW to 355 kW, arrives with a verified efficiency class on the nameplate. This matters for grounding your baseline calculation in a reliable reference; the more documented the rated efficiency in the denominator of your indicator, the more defensible the saving you compute. For an approach that takes the gap between nameplate and field figures seriously, our article on the nameplate versus field efficiency difference is a good starting point.
Defining the Boundary
Before any measurement you must state clearly what you are measuring. ISO 50006 calls this the boundary. The boundary can be a single motor, a drive system, a production line, or the whole facility. Set it too wide and the effect of the motor renewal you want to track gets lost among thousands of other loads. Set it too narrow and you may miss the real behaviour of the system. To see the impact of a motor fleet change, the ideal boundary is usually a sub-panel or line level where a metering point can be installed. Once you fix the boundary, you must fully define all energy inputs that cross into it and the production output that crosses out of it.
Building the Baseline Period
The baseline is a reference period that represents the facility's "normal before the change." It must be a span that covers the plant's typical production conditions before the motor renewal. A twelve-month period is usually preferred to capture seasonal effects, so that both the summer and winter load profiles are reflected in the baseline. When selecting the baseline period, unusual events such as long outages, trial runs, or major breakdowns should be either excluded or documented. The goal is a clean data set that represents normal operating conditions.
Throughout the baseline period you must collect not only energy consumption but also data on the relevant variables: production quantity, ambient temperature, operating hours, product mix, and so on. This paired data is the raw material of the normalization model. Gathering energy and variables at the same time resolution (for example weekly or monthly) determines the robustness of the regression model you will build later.
Normalization with Regression
Normalization is the act of stripping raw consumption of the influence of relevant variables. The most common method is regression analysis. Over the baseline period you take energy consumption as the dependent variable and drivers such as production volume and temperature as independent variables, then express the relationship between them with a mathematical model. For example, a simple model might read "consumption = constant base load + (production volume × energy per unit)." The constant term represents lighting, standby, and leakage loads that run even with no production; the slope term represents the energy added by each extra unit of production.
Once the model is built, you feed the post-renewal period's actual variable values (for instance that month's production volume and temperature) into it. The model answers the question "if nothing else had changed, how much energy would these conditions have required?" This is called the expected or predicted consumption. The difference between actual and predicted consumption gives the normalized saving, that is the avoided energy. To carry this approach into annual reporting, our content on measuring and documenting annual savings on high-efficiency motors offers a practical guide.
To judge the model's reliability, you look at statistical measures such as the coefficient of determination (R²) and the distribution of residuals. As R² approaches 1, most of the variation in energy consumption is explained by the variables you chose, indicating that the normalization is sound. A low R² usually signals that you have overlooked an important relevant variable.
Verifying the Saving: CUSUM and Avoided Energy
An effective way to track the normalized saving over time is the cumulative sum, or CUSUM, chart. For each period you calculate the difference between actual and predicted consumption, then accumulate those differences cumulatively. In a facility where the motor renewal truly works, the CUSUM curve trends steadily downward from the renewal date onward; this is visual proof of a continuously accumulating saving. If the curve flattens or rises again, it signals degraded performance or a drift and calls for intervention.
The avoided-energy concept expresses the saving as an absolute number and is especially powerful for financial justification. Saying "this year we spent 180,000 kWh less than the baseline predicted" is far more defensible than saying "our bill went down," because production and weather are already built into the equation. This figure is used both in internal reporting and in external audits to prove the return on the investment.
Impact on Purchasing and Fleet Renewal Decisions
A saving that is measured and documented correctly is not merely an accounting exercise; it forms the basis of future purchasing decisions. When you numerically prove the real return of switching a drive to an IE4 or IE5 motor, you have a solid business case for rolling out the same approach across the entire fleet. These normalized figures are also accepted when you apply to incentive programmes and energy audits, because you are already protected against the "but production changed" objection that an independent auditor might raise.
HEM Motor's IE4 Super Premium and IE5 Ultra Premium series, with 100% copper windings, class F insulation, IP55 protection, and reinforced bearings, do not just offer high rated efficiency; thanks to a documented efficiency class they form a reliable reference point for your baseline calculations. To evaluate the renewal decision holistically with the cost dimension, see our article on the total cost of ownership of high-efficiency motors, and to choose the right model and efficiency class, explore the IE4 Electric Motors product family. For current electric motor prices and options, visit our product pages.
Implementation Steps in Summary
- Define the motor system to be monitored and the energy boundary clearly.
- Identify the relevant variables such as production, temperature, and operating hours.
- Select a clean baseline period that covers seasonality and collect the data.
- Build the baseline by establishing a regression model between energy and the variables.
- Normalize the post-renewal consumption and verify the avoided energy with CUSUM.
- Document the results for incentive, audit, and fleet-renewal decisions.
Frequently Asked Questions
How long should the baseline period be?
The general rule is to choose a period long enough to capture seasonal effects, which in most facilities spans roughly twelve months. Shorter periods cannot adequately represent weather and production fluctuations, which lowers the robustness of the normalization model. What matters is that the period reflects the plant's typical and stable operating conditions; unusual outages and trial runs should be filtered out or documented.
How do I identify the relevant variables?
A relevant variable is any factor that genuinely affects energy consumption and changes over time. Production volume ranks first in almost every facility, followed by ambient temperature, operating hours, product mix, and number of shifts. You confirm which variable matters by examining its explanatory power in the regression analysis (its statistical significance and contribution to R²). Removing variables with low explanatory power simplifies and strengthens the model.
Does nameplate efficiency reflect the saving calculation well enough?
The efficiency class on the nameplate is a reliable starting point for the baseline, but the actual field efficiency can deviate from the rated value due to load point, supply quality, installation conditions, and ageing. For that reason a serious savings verification should be supported with field measurements rather than relying on the nameplate value alone. Choosing a motor with a documented efficiency class minimizes the gap between nameplate and field and keeps your calculations defensible.