English
 Türkçe
The most common question asked before replacing an electric motor deserves a measurable answer: will the new motor truly save energy, and if so, how long until the investment pays for itself? A digital twin turns this question from guesswork into a data-backed decision. By combining the motor, the load, the duty cycle and any variable frequency drive into a single software model, it calculates annual kilowatt-hour consumption, losses and payback period before the purchase is ever made. In this article we explore the concept of efficient motor energy simulation in accessible yet technical terms, showing with numbers why and how much moving to IE3/IE4/IE5 motors makes sense.
Our goal is not to promise a magic box. A digital twin is only as good as the measurement data feeding it. Set up correctly, however, it exposes the chronic energy waste caused by incorrect sizing and clarifies which motor belongs where. When researching elektrik motoru fiyatları, remember that the main cost is not the purchase price but the energy a motor consumes over its lifetime.
What Is a Digital Twin and What Does It Do for a Motor System?
A digital twin is a software model that mimics the behaviour of a physical asset, either in real time or on a scenario basis. In a motor application this model covers not only the motor itself but the entire system it drives: the motor, coupling and gearbox, the driven load (pump, fan, compressor, conveyor), the duty cycle, and the variable frequency drive if one is present. This integrated view is critical, because a motor's real efficiency is determined not by its nameplate alone but by the load profile of the system it operates within.
Traditional calculation takes the rated power and rated efficiency and performs a simple multiplication. In reality, motors rarely run at full load. A motor's efficiency curve varies with load ratio; most motors peak around 75 percent load and fall off sharply below 25 percent. A digital twin combines this curve with the actual load profile to compute the real consumption accumulated over a year instead of a single snapshot value.
Inputs Needed for the Simulation
The data gathered to build a motor energy twin directly determines the reliability of the model. Missing or estimated inputs reduce confidence in the results. The typical inputs required are:
- Rated power and current efficiency class: the motor's kW rating and whether it is currently IE2, IE3 or an older class.
- Load profile and duty cycle: at what load levels and for how long the motor runs during the day. Constant load, variable load, or frequent start-stop?
- Annual operating hours: single shift, double shift or continuous operation make a major difference.
- Grid tariff: the energy cost per kWh, ideally split by day and night rates.
- Presence of a variable frequency drive: whether the motor is run directly online (DOL) or through a VFD.
The most critical of these is the load profile. Ideally, real current and power are measured with a data logger or smart meter. If no measurement exists, a reasonable profile can be derived from the production plan and equipment catalogue curves; in that case the result must be presented as an estimated range.
Outputs the Simulation Produces
Once the inputs are processed, the digital twin produces concrete outputs that support the purchasing decision. Foremost is annual energy consumption, followed by a loss breakdown showing where that energy goes, and finally the payback period of an investment.
Loss Breakdown by Source
Losses in a motor arise from several distinct mechanisms, and the simulation can separate them:
- Iron (core) losses: hysteresis and eddy-current losses created by the magnetic field; almost independent of load and always present.
- Copper (winding) losses: losses from winding resistance that grow with the square of current as load increases.
- Friction and windage losses: mechanical losses from bearing friction and the cooling fan moving air.
- Stray load losses: arising from harmonics and leakage magnetic fields, the hardest component to model.
The advantage of IE4 and IE5 motors over IE2/IE3 comes largely from reducing iron and copper losses. With better core steel, optimised winding geometry and improved cooling, they do the same work with fewer losses. The simulation expresses this difference clearly in annual kWh.
CO2 and Payback Period
The annual kWh difference is multiplied by the grid carbon intensity to convert it into annual CO2 reduction. The same saving, multiplied by the energy tariff, gives the annual monetary gain. Dividing the extra cost of the new motor by this annual gain yields the IE4 payback period. In continuous, high-load applications this period is often just a few years or even a few months; in a motor that runs only a few hundred hours a year, payback can stretch to decades. This is precisely where the simulation adds value: it prioritises which motors are worth replacing and which should wait. To deepen this approach, see our article on total cost of ownership TCO for high efficiency motors.
Right-Sizing: The Oversized Motor Trap
One of the most widespread causes of energy waste in the field is selecting motors larger than needed. With a "just in case" mindset, a 22 kW motor is fitted where 11 kW would suffice. The result is a motor running permanently in the low-load region, well below the peak of its efficiency curve. The digital twin overlays the real load profile onto the motor's efficiency curve to make this mismatch visible and recommends the motor power that genuinely fits the application.
Correct sizing delivers not only energy savings but also improved power factor and lower operating temperature, which extends motor life. The most reliable way to detect an incorrectly sized motor is to measure and model the existing inventory. Our guide on energy efficiency audit and motor inventory offers a systematic starting point.
Scenario Comparison: DOL versus VFD
Perhaps the most powerful aspect of a digital twin is the ability to compare scenarios side by side. In variable-flow applications such as pumps and fans, the difference between direct-on-line (DOL) operation and a variable frequency drive (VFD) is striking. The affinity laws that apply here state that power varies with the cube of speed: reducing flow to 80 percent can theoretically cut power to roughly 50 percent.
Reducing motor speed with a VFD instead of throttling a valve delivers large savings thanks to this cubic relationship. The simulation models the effect of raising the motor's efficiency class and adding a VFD both separately and together to find the most sensible combination. For details on this topic, our article on high efficiency motor plus frequency drive savings on pumps and fans will be useful. To explore the payback of an efficiency upgrade more deeply, see our content on the payback period of replacing an old motor with IE4.
Ecodesign and the Regulatory Framework
Choosing an efficiency class is increasingly not just an economic matter but a legal one. Under the European Ecodesign regulation, since July 2021 IE3 has become the mandatory minimum class for direct-on-line motors between 0.75 kW and 1000 kW. This means that in new investments, motors below IE3 are practically not an option. The digital twin identifies which low-class motors in the existing inventory should be renewed first, supporting compliance and savings goals simultaneously.
From Simulation to Purchase: A Data-Backed Decision
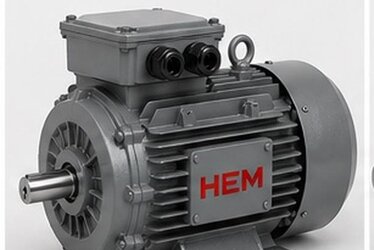
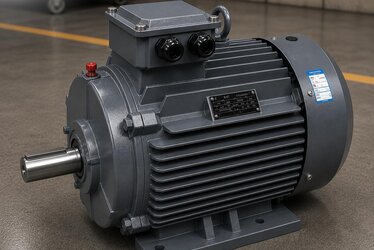
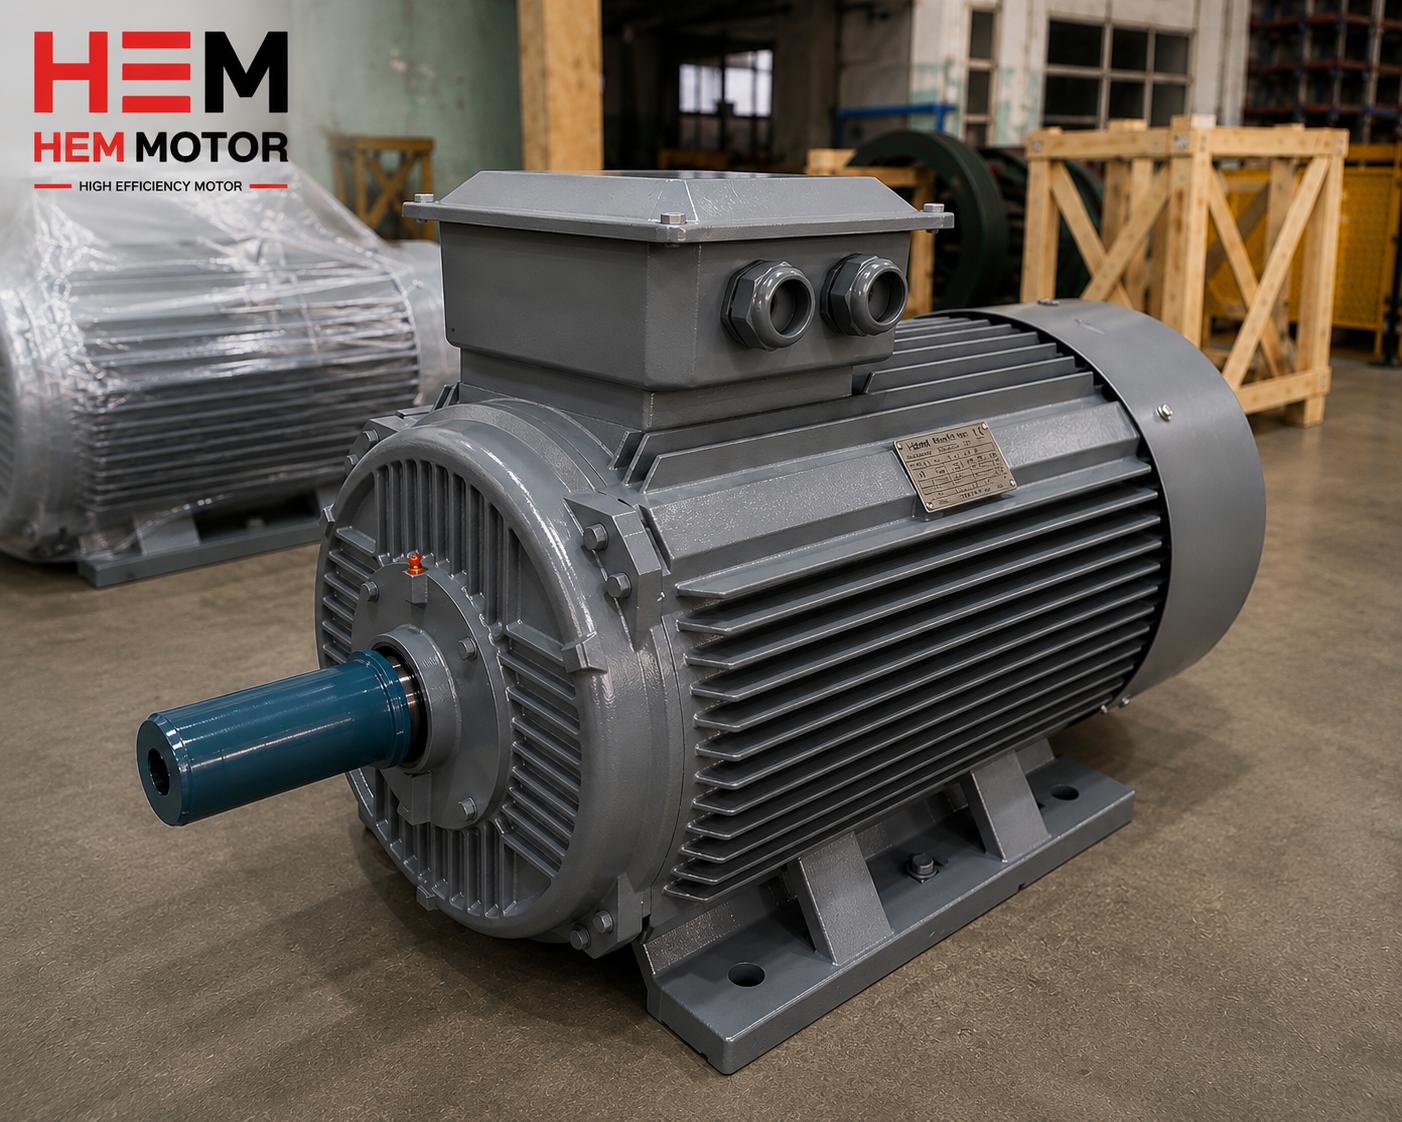
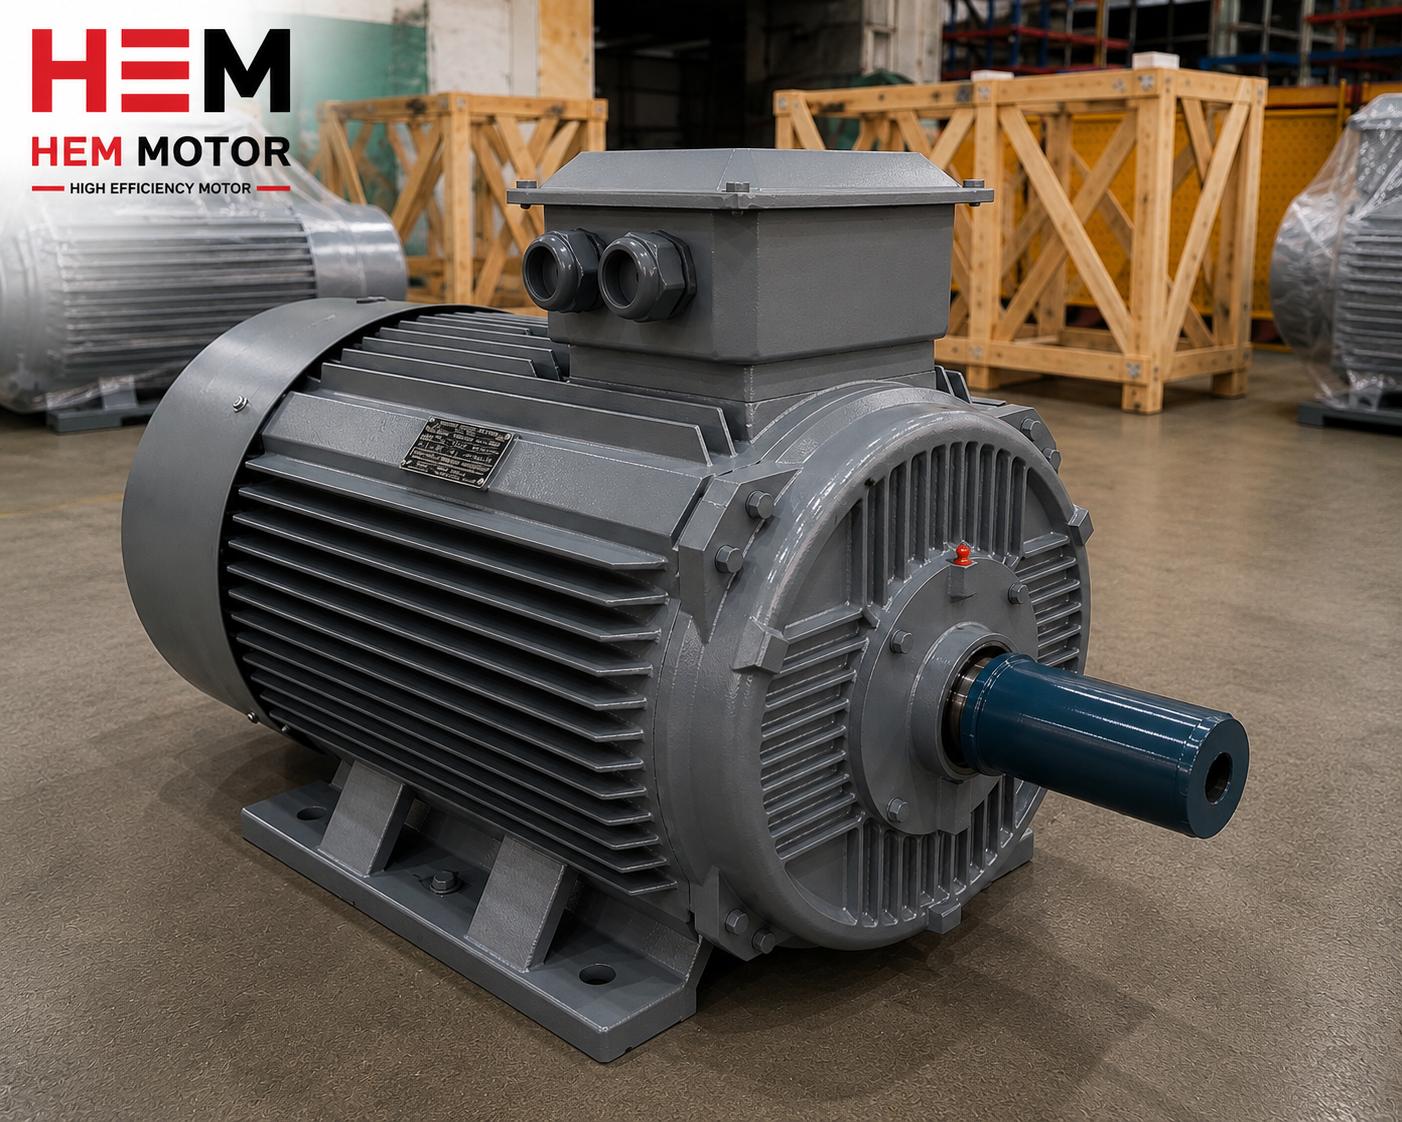
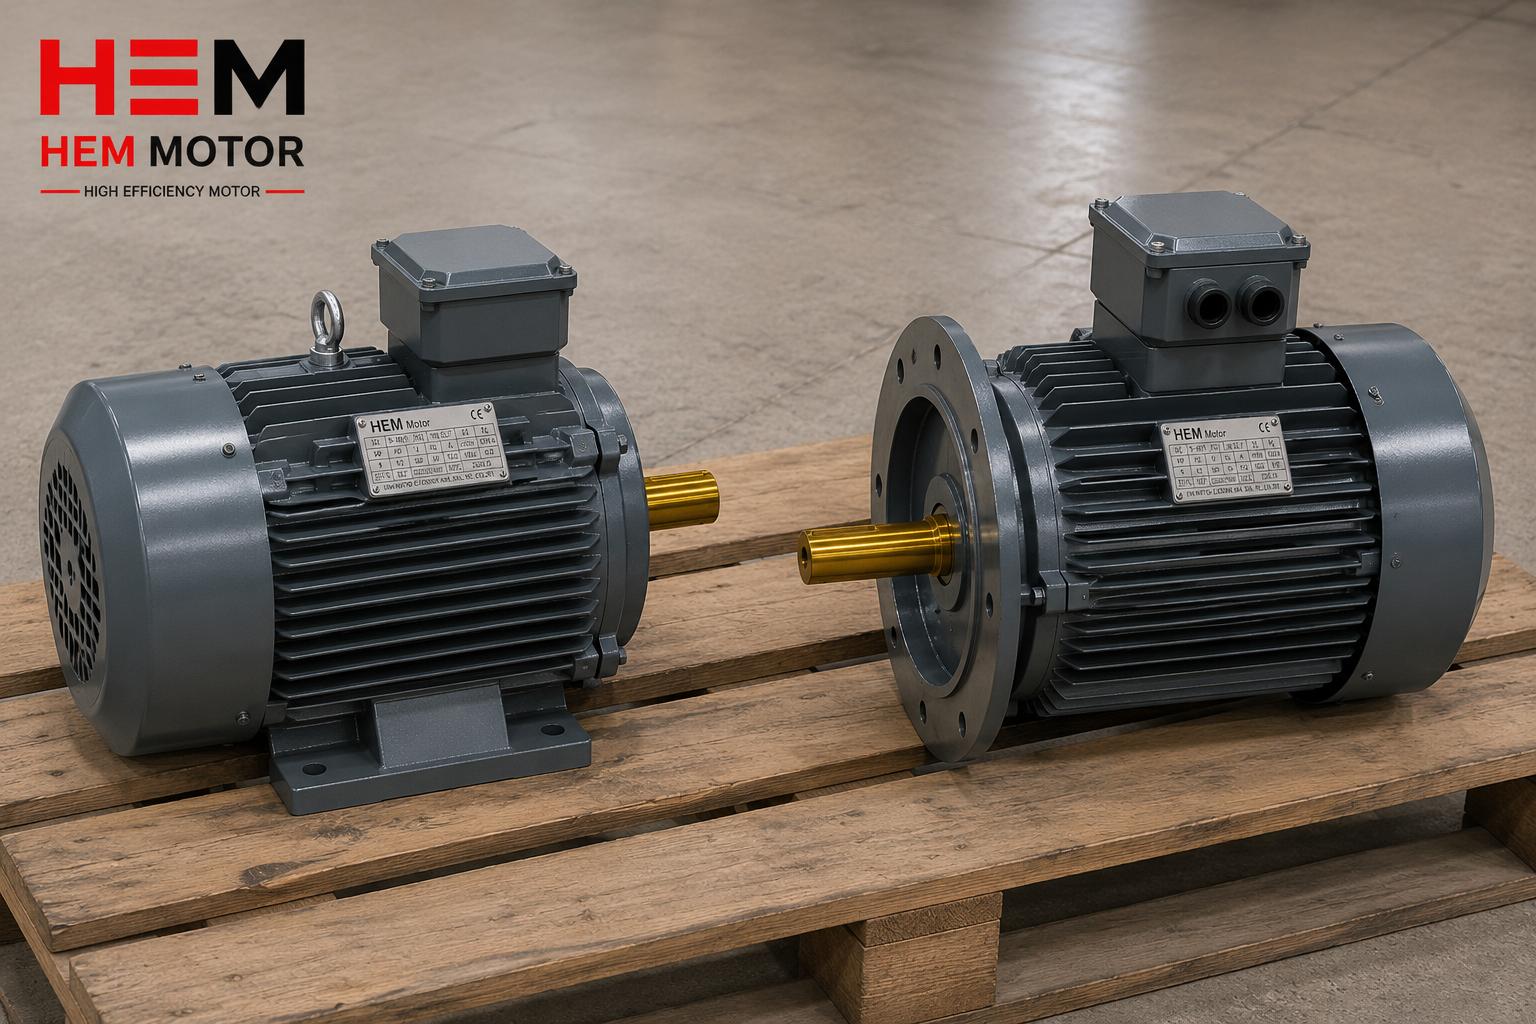
The ultimate value of a digital twin is not an abstract report but a concrete decision. When the simulation says "upgrading the 30 kW motor on that line to IE4 will save this many kWh per year on the current load profile and pay back in this much time", all that remains is to source the right motor. HEM Motor supplies the IE3/IE4/IE5 motors and reducers the simulation recommends, from stock and with manufacturer assurance, and supports reviewing your motor inventory and defining the correct specifications for a quote.
To compare your efficiency class options, explore our high efficiency electric motors product group. What matters is that the decision rests on measured load data, not a guess.
Model Accuracy: Calibration and Validation
A digital twin is not a one-off spreadsheet; it is a living model. Once built, the predictions it produces should be checked regularly against real measurements in the field. This calibration step is often skipped, yet it is the cornerstone of reliability. For example, if the model predicts a motor consumes 4,200 kWh in a given month, the actual meter reading should fall within about five percent of that. If the deviation is large, either the load profile assumptions or the motor efficiency curve parameters are reviewed.
The validation process keeps the model accurate not only under normal conditions but also through seasonal changes. A cooling fan running far longer in summer than in winter, or a pump changing flow with the production season, can significantly affect the annual estimate. A well-constructed efficient motor energy simulation incorporates these seasonal patterns into the profile, bringing the annual total much closer to reality.
Common Mistakes and How to Avoid Them
Several mistakes frequently made when building a simulation directly undermine the reliability of the results. Knowing these traps in advance markedly increases the value extracted from the model:
- Mistaking rated load for actual load: using nameplate power directly in the consumption calculation is the most common error. Real average load is often well below the rated value.
- Over- or under-counting operating hours: shift plans, weekend stops and holidays heavily affect the estimate; calendar-based real hours must be used.
- Treating efficiency as constant: multiplying by a single efficiency value hides the drop at low load. The full curve must be modelled.
- Ignoring drive losses: a VFD also adds a small loss; the savings calculation must honestly account for it.
- Disregarding power factor and harmonics: power factor drops at low load, affecting the real cost on the grid side.
The common denominator of these mistakes is assumption-based shortcuts. A measurement-driven approach hardens the model by replacing each shortcut with real data. Given that a critical output such as the IE4 payback period steers the investment decision, the rigour of the inputs directly determines the quality of that decision.
Prioritisation: Which Motor to Start With?
A facility may have dozens or even hundreds of motors, and renewing them all at once is neither feasible nor necessary. The most practical benefit a digital twin offers is directing the renewal budget toward the motors that deliver the highest return. The simulation produces an investment map by ranking each motor on the axes of "annual savings potential" and "payback period". The motors landing in the top-right corner of this map, those that both consume heavily and pay back quickly, are renewed first.
This prioritisation ensures a limited budget creates the greatest impact. In most facilities, a small number of large, continuously running motors account for the bulk of energy consumption; the digital twin marks these clearly. The remaining small and infrequently used motors can be upgraded to an efficient class within the natural replacement cycle when they fail.
Frequently Asked Questions
Do I need expensive sensors to build a digital twin?
No. Real current and power measurement is ideal, but even a few days of logging with a portable power analyser produces a valuable profile to start with. If measurement is not possible, a reasonable estimate can be derived from the production plan and catalogue curves; in that case the result is interpreted as a range.
Does the simulation result guarantee real savings?
The simulation is an estimate and is only as accurate as the data feeding it. When the load profile is measured correctly, the estimate comes very close to reality; but if process parameters change, so does the result. That is why periodically updating the twin is recommended.
In which applications is the payback of an efficiency upgrade fastest?
As a general rule, payback is fastest in motors that run many hours at high, steady load. In variable-flow systems such as pumps and fans, savings increase further when a variable frequency drive is added to the efficiency-class upgrade.